How to calculate Java Objects, Arrays, Primitives, and Complex Classes. Checking calculated size correctness using JProfiler.
In this tutorial, we will learn how to estimate all possible java objects or primitives. This knowledge is critically important, especially for a production application. You might think that now most of the servers have enough memory that covers all possible application’s needs. Well, in some sort you are right — hardware, it’s pretty cheap compared to a developer’s salary. But still, it’s pretty easy to meet very consumable situations e.g.:
- Caches especially with long strings.
- Structures with a big number of records (e.g., a tree with nodes built from the huge XML file).
- Any structures that replicate data from the database. In the next step, we begin estimating Java objects from primitive to more complex structures.
Java Primitive
Sizes of Java Primitives is well known and provided from the box:

Minimal Memory Word for 32 and 64 Bit Systems
The minimal size of the memory word for 32 bit and 64 bit is 8 and 16 bytes respectively. Any smaller length is rounded by 8. During the calculation, we will consider both cases.

Due to the nature of memory (word size) structure, any memory is multiple of 8 and if it’s not the system will automatically add additional bytes (but the minimal size is still 8 and 16 bytes for 32/64 systems).

Java Object
Java object has no fields inside and according to specification, it has only metadata called header. The Header contains two parts: Mark Word and Klass pointer.

And how it looks like in Java Memory:

Java Primitive Wrappers
In Java, everything is an Object except primitive and references (the last one is hidden). So all wrapper classes just wrap corresponding primitive type. So wrappers size in general = object header object + internal primitive field size + memory gap. The sizes of all primitive wrappers are shown in the next table:

Java Array
Java Array is pretty similar to objects — they also differ for primitive and object values. The array contains headers, array length, and its cells (to primitive) or reference to its cells (for objects). For clarifying let’s draw an array of primitive integers and big integers (wrappers).
Array of Primitives (Integer in Our Case)

Array of Objects (Bit Integer in Our Case)

So as you can see the key difference between primitive and object arrays — additional layer with references. In this very example the reason for most memory loss — usage of an Integer wrapper which adds 12 extra bytes (3 times more than primitive!).
Java Class
Now we know how to calculate Java Object, Java Primitive, and Java Primitive Wrapper and Arrays. Any class in Java is nothing but an object with a mix of all mentioned components:
- header (8 or 12 bytes for 32/64 bit os).
- primitive (type bytes depending on the primitive type).
-
object/class/array (4 bytes reference size).
Java String
Java string it’s a good example of the class, so besides header and hash it encapsulates char array inside, so for a long string with length 500 we have:

But we have to consider that the Java String class has different implementations, but in general, the main size holds by char array.
How to Calculate Programmatically
Checking Size Using Runtime freeMemory
The easiest way, but not reliable is to compare the difference between total and free memory after and before memory initialization:
long beforeUsedMem=Runtime.getRuntime().totalMemory()-Runtime.getRuntime().freeMemory();
Object[] myObjArray = new Object[100_000];
long afterUsedMem=Runtime.getRuntime().totalMemory()-Runtime.getRuntime().freeMemory();
Using Jol Library
The best way is to use Jol library written by Aleksey Shipilev. This solution will pleasantly surprise you with how easily we can investigate any object/primitive/array. In order to do it you need to add the next Maven dependency:
<dependency>
    <groupId>org.openjdk.jol</groupId>
    <artifactId>jol-core</artifactId>
    <version>0.16</version>
</dependency>
and feed to ClassLayout.parseInstance anything you want to estimate:
int primitive = 3; // put here any class/object/primitive/array etc
System.out.println(VM.current().details());
System.out.println(ClassLayout.parseInstance(primitive).toPrintable());
as output you will see:
# Running 64-bit HotSpot VM.
# Using compressed oop with 0-bit shift.
# Using compressed klass with 3-bit shift.
# Objects are 8 bytes aligned.
# Field sizes by type: 4, 1, 1, 2, 2, 4, 4, 8, 8 [bytes]
# Array element sizes: 4, 1, 1, 2, 2, 4, 4, 8, 8 [bytes]

java.lang.Integer object internals:
OFF  SZ   TYPE DESCRIPTION               VALUE
  0   8        (object header: mark)     0x0000000000000001 (non-biasable; age: 0)
  8   4        (object header: class)    0x200021de
 12   4    int Integer.value             3
Instance size: 16 bytes
Space losses: 0 bytes internal + 0 bytes external = 0 bytes total
Using Profiler
As an option, you can use profilers (JProfiler, VM Visualizer, JConsole, etc.) in order to observe how much memory is consumed by this or another structure. But this solution is rather about profiling memory and not object structure. In the next paragraph, we will use JProfiler to confirm that our calculation is correct.
Making Database Cache Class and Calculating Its Size
As a realistic example, we create classes that represent data from some database table with 5 columns and 1.000.000 records in each of them.
public class UserCache{
    public static void main(String[] args){
        User [] cachedUsers = new User[1_000_000];
        while(true){}
    }
    private static class User{
        Long id;
        String name; //assume 36 characters long
        Integer salary;
        Double account;
        Boolean isActive;
    }
}
So now we created 1M users, right? Well, doesn’t matter what it’s inside the User class — we just created 1M references. Memory usage: 1M * 4 bytes = 4000 KB or 4MB. Not even started, but paid 4MB.
Profiling Java Memory for 64-bit Systems
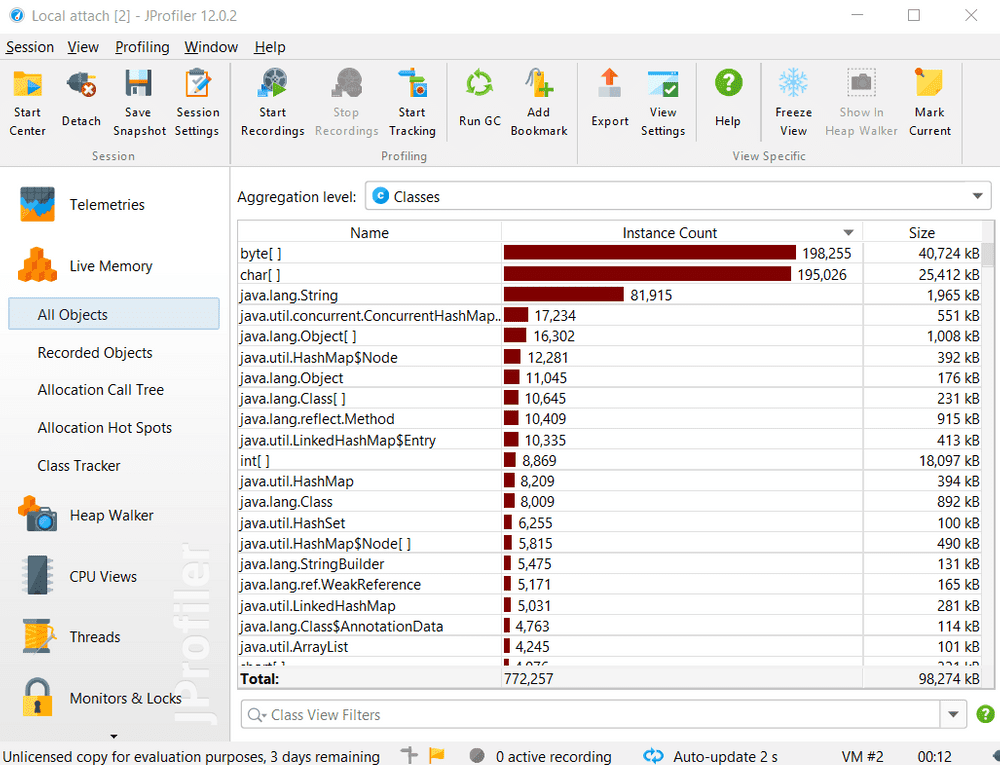
In order to confirm our calculation, we execute our code and attach JProfile to it. As an alternative, you can use any other profiler eg VisualVM (it’s free). If you never profiled your application, you can check this article. Here an example of how the profile screen looks like in JProfiler (it’s just an example not related to our implementation).

Tip: when you profile an app you can run GC from time to time to clean up unused objects. So the results of profiling: we have User[] reference points to 4M records and has a size of 4000KB. When we profile

As the next step we initialize objects and add them to our array (the name is unique UUID 36 length size):
for(int i = 0;i<1_000_000;i++){
    User tempUser = new User();
    tempUser.id = (long)i;
    tempUser.name = UUID.randomUUID().toString();
    tempUser.salary = (int)i;
    tempUser.account = (double) i;
    tempUser.isActive = Boolean.FALSE;
    cachedUsers[i] = tempUser;
}
Now let’s profile this app and confirm our expectations. You might mention that some values are not precise, e.g., Strings are 24.224 sizes instead of 24.000 but we count all String including internal JVM strings and the same related to Boolean.FALSE object (estimated to 16 bytes, but in profile, it’s 32 obviously because Boolean.TRUE is also used by JVM internally).

For 1M records, we spend 212MB and it’s only 5 fields and all string lengths are limited by 36 chars. So as you can see that objects are pretty greedy. Let’s improve the User object and replace all objects with primitives (well excepts String).

Just by changing fields to primitives, we saved 56MB (about 25% of used memory). But also we improved performance by removing additional references between the user and primitive.
How to Reduce Memory Consumption
Let’s list some simple ways to save your memory consumption:
Compressed OOPs
For 64 bit systems, you can execute JVM with compressed oop param. It’s a pretty big subject and you can read this article compressed oop params.
Extract Data From A Child Object to Parent
If the design allows moving fields from child to parent class it might save some memory:

Collections With Primitives
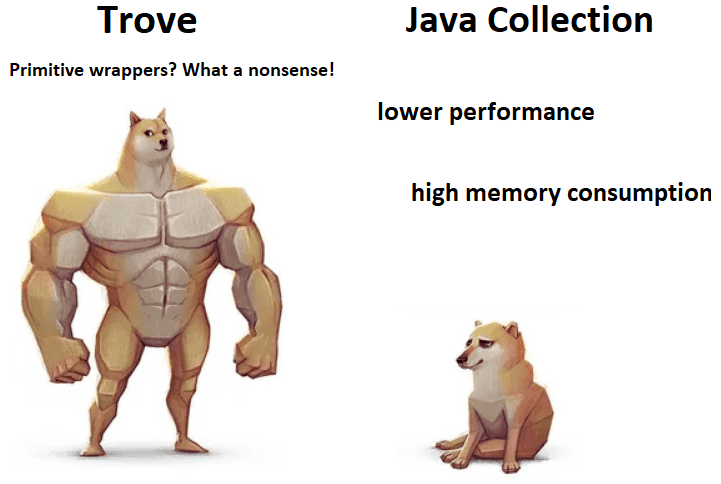
From previous examples, we saw how primitives wrappers waste a lot of memory. Primitive arrays are quite are not user friendly as the Java Collection interface. But there is an alternative: Trove, FastUtils, Eclipse Collection, etc. Let’s compare memory usage of simple ArrayList
TDoubleArrayList arrayList = new TDoubleArrayList(1_000_000);
List<Double> doubles = new ArrayList<>();
for (int i = 0; i < 1_000_000; i++) {
  arrayList.add(i);
  doubles.add((double) i);
}
Generally, the key difference is hidden in Double Primitive Wrapper objects, not in ArrayList or TDoubleArrayList structure. So simplifying the difference for 1M records:

So just by changing the collection we easily reduce consumption in 3 times.

